Positive impacts of a whole-of-home approach on energy performance
For the average 4-person household, the savings from using energy-efficient appliances can be as much as $22,750 over the 25-year appliance life span.
Annually, the switch to energy-efficient appliances can result in energy bill cost savings of between $555 (mixed fuel home) – $910 (all electric home) per year. This is assuming that energy prices remain the same.
Better yet, the appliance upgrade cost is often negligible and usually less than $1,000 per appliance. In some cases, there is even an opportunity to save on build costs by reducing extra installation work. For example, instead of installing both heating and cooling ducting, reduce installation costs by using the same system to do both. Reducing the amount of installation also reduces the need to remove and replace insulation, therefore preserving the thermal performance of the home.
 NatHERS energy rating and appliance energy labelling as part of a whole-of-home approach.
 A whole-of-home approach
A whole-of-home approach to energy efficiency brings into consideration the performance of appliances within a home and their impact on overall energy use, greenhouse gas emissions, and cost.
Building on the nationally-agreed Trajectory for Low Energy Buildings, the Australian Building Codes Board is considering a whole-of-house-energy use budget as part of strengthening energy efficiency provisions in the 2022 edition of the National Construction Code (NCC).
At the same time, the Nationwide House Energy Rating Scheme (NatHERS) is being expanded to assess and rate whole-of-home energy performance, which will support compliance with new requirements in the NCC.
While the NCC’s approach is
yet to be finalised, this case study demonstrates the benefit of a
whole-of-home approach on energy performance and encourages its application in
addition to thermal performance standards.
In addition to the fixed regulated appliances considered by NatHERS, this case study also considers cooking appliances and plug load. These inclusions go beyond the proposed changes to the NCC. The ‘plug load’ is a default value for energy use from plug in appliances such as a fridge and washing machine.
 Inclusions in this case study.
 Energy performance tool
Sustainability Victoria (SV) has developed a pilot whole-of-home assessment tool. The tool calculates annual home energy use, cost and greenhouse gas emissions. It uses SV’s current house energy rating software, FirstRate5, as well as information about the appliances that will be installed.
Energy rating information about individual appliances is based on the national energy labelling scheme In turn, the tool provides key information about a home’s energy performance. This enables builders and assessors to make informed choices when designing their homes.
SV’s tool includes the following appliances in the assessment.
Fixed regulated appliances, such as:
- heating and cooling systems
- hot water systems
- lighting
- pool and spa pumps
- on-site renewable energy generation.
As well as appliances not anticipated to be regulated under the NCC, such as:
- cooking appliances
- plug-in appliances.
Note: based on SV research, a default value for the energy consumption of plug-in appliances, is applied to ensure that all energy needs within the home are considered.
Consumer benefits
By completing a whole-of-home assessment with SV’s pilot tool, builders get detailed information about energy efficiency upgrades to share with home buyers. This can be very helpful at the point of sale, when trying to show value to potential buyers.
SV’s tool provides information on how the home will perform when occupied. Including information on annual energy use, annual energy cost and greenhouse gas emissions.
This is different to a standard NatHERS assessment, which rates the energy efficiency of a home’s thermal envelope based on its design. While a NatHERS rating estimates a home’s potential heating and cooling load it does not include consideration of the efficiency of any appliances. Therefore, it does not provide information about annual energy use, annual energy cost and greenhouse gas emissions.
Application and analysis
This analysis was completed using an earlier version of the whole-of-home pilot tool. We will update this case study using data from the new tool once available.
To demonstrate the impacts of a whole-of-home approach, the following scenarios have been prepared using a 7.1 Star NatHERS rated home, called home X. Home X is a 217 m2, 4-bedroom, single story home with 4 occupants. View the floor plan (png, 43kB).
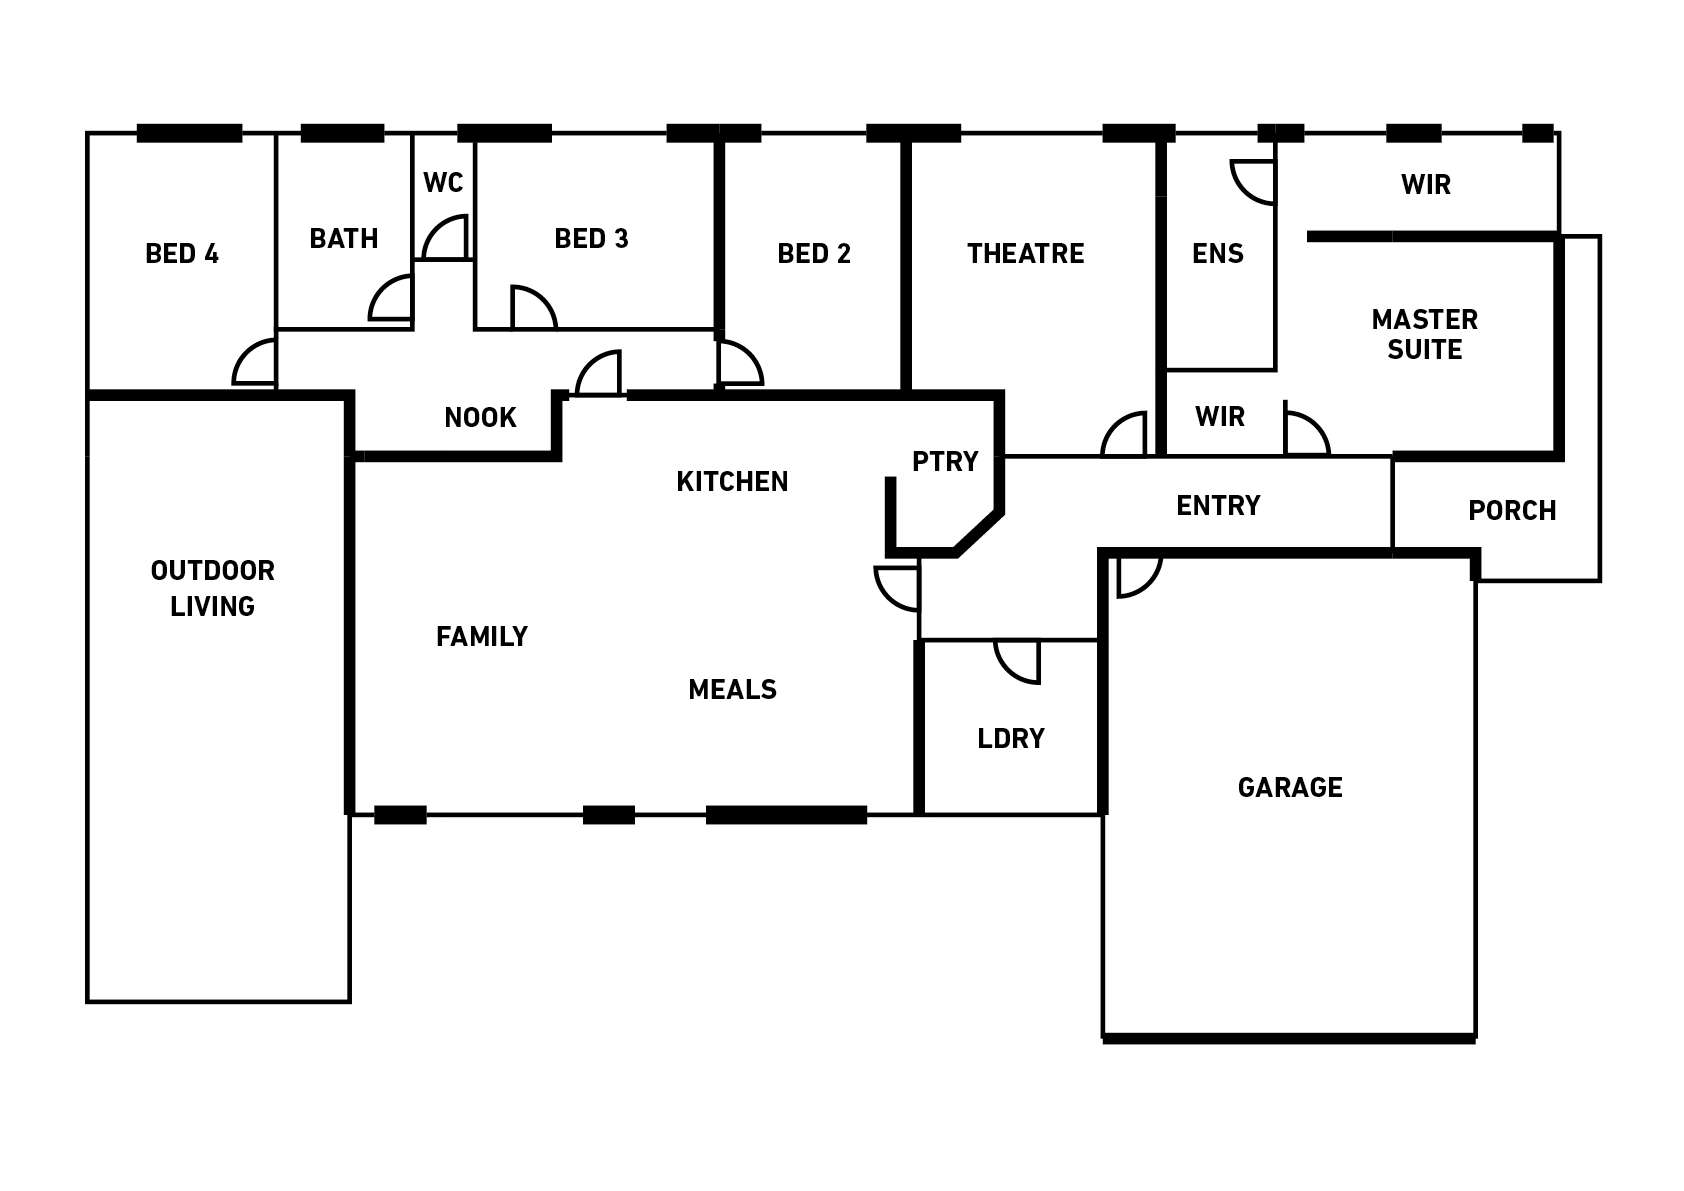
As reflected by its star rating, the home has a well performing thermal envelope. This is on par with proposed changes to the NCC.
For heating and cooling this means a 25 per cent reduction in annual energy load, compared to that of a 6-star home. This translates into energy-bill savings and confirms the importance of an enhanced thermal envelope in addition to a whole-of-home approach.
Comparison between Home X and a standard 6.2 star home
| Home X | Standard home | |
|---|---|---|
| NatHERS star rating | 7.1 | 6.2 |
| Predicted annual energy load for heating and cooling | 89.3 MJ/m2 | 118.1 MJ/m2 |
Appliance choice
There are many appliance combinations that can go into a home. The next table provides an overall comparison of outcomes for home X between appliances offered by builders (except for the hot water services in Victoria, refer below in the hot water service section) and an upgrade to more energy-efficient appliances. The selection reflects common choices within the Australian residential building sector. Less common choices such as bottled gas and in slab-electric heating have not been considered.
The examples used in this case study don’t consider solar PV or the associated benefits of solar PV on a whole-of-home approach. More detail on including solar PV and its impacts on energy performance is provided in the solar PV articles (coming soon).
Home X inclusion options
| Appliance | Gas option A (less efficient choice) | Gas option B (efficient choice) | Electric option A (less efficient choice) | Electric option B (efficient choice) |
|---|---|---|---|---|
Lights |
Combination (5W/m2) |
LED (1.7 W/m2) |
Combination (5W/m2) |
LED (1.7 W/m2) |
Hot water and cooking |
Gas cooktop; electric oven; Gas instantaneous hot water system |
Gas cooktop; electric oven; Solar gas boosted hot water service |
Electric cooktop; electric oven; electric storage (off peak) hot water system |
Induction cooktop; electric oven; heat pump (off peak) hot water system |
Heating and cooling |
3-star ducted gas heating system; reverse cycle ducted cooling system (AEER 3.1) |
5-star ducted gas heating system; split cooling systems in living rooms (7KW, 4-star energy rated) and bedroom (3KW, 5 star energy rated) |
Reverse cycle ducted cooling system (ACOP/AEER 3.1) |
Split cooling systems in living rooms (7KW, 4-star energy rated) and bedroom (3KW, 5-star energy rated) |
Assumed plug in load |
Annual performance data
| Gas Option A (less efficient choice) | Gas Option B (efficient choice) | Electric Option A (less efficient choice) | Electric Option B (efficient choice) | |
|---|---|---|---|---|
| Greenhouse gas emissions | 5.8 tCO2-e | 4.0 tCO2-e | 7.7 tCO2-e | 4.6 tCO2-e |
| Energy use | 62,210 MJ | 39,307 MJ | 37,609 MJ | 22,094 MJ |
| Annual energy cost | $2,646 | $2,091 | $2,756 | $1,846 |
| Annual energy cost saving | $555 | $910 |
In summary, the appliance scenarios tested for home X showed that:
Gas option A
This option was fitted with less efficient gas appliances and used 120 percent more energy* than the most efficient option, electric option B and 37% more energy than the more efficient gas option B. It also has the second highest energy cost of all 4 options and the second highest greenhouse gas emissions.
Gas option B
This option provided a significant energy cost saving when compared to gas option A of $555 p.a. Even though it was the second highest energy user, when it came to greenhouse gas emissions it was the best performing with only 4.0 tCO2-e p.a.
Electric option A
Choosing less efficient electric appliances used less energy than both gas options but was the most expensive to run and emitted the most greenhouse gas, coming in at 7.7 tCO2-e p.a.
Electric option B
This option provided a large saving when compared to Electric option A of $910 p.a. This was the most energy-efficient of all 4 options, consuming less than half of the energy required in Gas option A. This option also performed comparatively well when it came to greenhouse gas emissions, coming in as the second lowest emitter of the 4 options.
Comparing gas and electrical services
There are several reasons why comparing gas and electrical services is difficult:
- Gas supply has a different greenhouse gas (ghg) coefficient to electricity, but it is likely to remain consistent for the foreseeable future; whereas the ghg coefficient of the electricity supply is legislated to become zero by 2050.
- Gas is a primary energy source while electricity is a secondary energy source.
Lighting
The NCC currently requires that the lighting power density of a home doesn’t exceed 5 W/m2. This is whilst also providing appropriate lighting levels in accordance with Australian Standard AS 1680.
Using SV’s whole-of-home tool, this table shows the energy performance of standard lighting vs. energy-efficient LED lighting in home X.
Home X Lighting
| Lighting type | Standard lighting | High efficiency LED lighting |
|---|---|---|
Lighting power density |
5 W/m2 |
1.7 W/m2 |
Annual energy use |
4,294 MJ |
1,460 MJ |
Annual energy cost |
$302 |
$103 |
Annual greenhouse gas emissions |
0.9 tonnes |
0.3 tonnes |
According to the builder, the cost difference to upgrade home X’s lighting from other types to LED lights was $0, but it produced an annual bill saving for the homeowner of $199. Additionally, with LED lighting now available in all shapes and sizes switching over is an easy decision.
If electricity prices were to remain the same as they are today, including LED lights will help the homeowner save close to $5,000 over a 25-year lifetime. When you also factor in the longer lifespan of LEDs, when compared to incandescent or fluorescent lights, the homeowner is also saving on ongoing maintenance costs.
Please note: It is important to ensure that the LEDs used in efficient homes are IC4 rated as this ensures they pose a low fire risk if placed adjacent to the insulation in the ceiling.
Hot water systems and cooking appliances
It should be noted that there is currently a Victorian variation in the NCC that determines what types of hot water systems in new homes. As part of Victoria’s Climate Change Strategy, and aligned with proposed changes to the NCC, barriers to installing efficient electric hot water systems will be removed. This will expand the range of low-emissions choices available to households.
This table compares hot water systems and cooking appliance choices across both mixed fuel and fully electric scenarios, using home X. The comparison of four possible home appliance choices includes two with gas and two fully electric. In both scenarios, choosing the more energy-efficient appliances can cut energy use, energy costs and greenhouse gas emissions by around 50%.
Home X Fixed appliances
| Mixed fuel | Fully electric | |||
|---|---|---|---|---|
Cooktop |
Gas |
Gas |
Electric |
Electric-induction |
Oven |
Electric |
Electric |
Electric |
Electric |
Hot water system |
Gas instantaneous water heater |
Solar boosted gas water heater |
Electric storage (off peak) water heater |
Heat pump (off peak) water heater |
Annual energy use |
22,104 MJ |
8,145 MJ |
18,056 MJ |
7,503 MJ |
Annual energy cost |
$467 |
$219 |
$987 |
$426 |
Annual greenhouse gas emissions |
1.4 tonnes |
0.6 tonnes |
3.7 tonnes |
1.5 tonnes |
Although both the electric options are more expensive in this table, another point to consider is the higher energy efficiency of an induction cooktop and the fact that the gas attracts a supply charge of approximately $300, which is not shown here.
The assessment also showed that a solar gas boosted hot water system uses 63 percent less energy, produces 0.8 tonnes CO2-e p.a. less and is $252 cheaper to run (or $6,300 over 25 years) than a gas instantaneous hot water system.
If the gas supply charge is included in the considerations then it becomes clear that the cheapest option is to have efficient electric appliances.
Heating and cooling systems
Analysis of home X also revealed saving opportunities for heating and cooling systems.
Reduction in costs for heating and cooling are not just related to the efficiency of the appliances but are also heavily influenced by the thermal envelope of the home. However in this case the thermal envelope remained the same in all examples.
Home X Heating and cooling systems
| Mixed fuel | Fully electric | |||
|---|---|---|---|---|
Heating |
||||
All areas |
Ducted gas |
Ducted gas |
Ducted reverse cycle |
Primary: Room reverse-cycle Secondary: Room Reverse-cycle |
Capacity |
30 kW |
30 kW |
17 kW |
Primary: 7 kW Secondary: 3 kW |
Efficiency |
3-star |
5-star |
3.1 ACOP |
Primary: 3-star Secondary: 5-star |
Cooling |
||||
All areas |
Ducted refrigerative |
Primary: room refrigerative Secondary: room refrigerative |
Ducted refrigerative |
Primary: room refrigerative Secondary: room refrigerative |
Capacity |
17 kW |
Primary: 7 kW Secondary: 3 kW |
17 kW |
Primary: 7 kW Secondary: 3 kW |
Efficiency |
3.1 AEER |
Primary: 3-star Secondary: 5-star |
3.1 AEER |
Primary: 3-star Secondary: 5-star |
Annual performance data |
||||
Annual energy use |
27,111 MJ |
21,001 MJ |
6,558 MJ |
4,431 MJ |
Annual energy cost |
$566 |
$470 |
$461 |
$311 |
Annual greenhouse gas emissions |
1.7 tonnes |
1.3 tonnes |
1.4 tonnes |
0.5 tonnes |
For the mixed fuel scenario, the efficient option was changing from the typical 3-star gas ducted heating system to a 5-star gas ducted heating system. The cost of doing so was approximately $1,000. The switch resulted in a saving of $109 p.a, or $2,725 over a 25 year appliance lifetime (excluding supply charges and assuming that energy costs remain the same).
It’s also worth considering that efficient air-conditioning, such as room refrigerative, saves on installation costs and causes less interruption to the integrity of the insulation compared with a ducted system that has vents throughout the home. In home x, the cost of cooling the home with efficient split systems is $35 p.a. compared to an efficient reverse cycle ducted system which would cost $47 p.a.
For the all electric home, choosing split systems over a ducted reverse cycle system can be an instant saving of approximately $5,000. Additionally, the resulting energy cost saving is around $150 p.a. or $3,750 over a 25 year lifetime of the appliances (using today’s electricity prices).
Key learnings
- Design decisions made with a whole-of-home approach can provide long lasting savings to the homeowner.
- By using SV’s pilot whole-of-home tool, you can articulate the cost vs. benefit business case more confidently to consumers at point of sale.
- Whole-of-home assessments are easy to do and take only 10 minutes in addition to the First Rate 5 NatHERS assessment.
- Using efficient appliances is a cost-effective way to reduce the customers energy bills and provide your customers with a clear picture of what you can do to save them money.
- Energy efficiency labels on appliances are an easy and objective way to choose efficient appliances, as the ratings are based on well-established standard procedures. For more information on energy labels and efficient appliances visit the Federal Government’s energy rating website.
- If there is an opportunity to make the home fully electric, e.g. where the Victorian variation doesn’t apply, then the above data demonstrates the cost savings of efficient electric appliances over other choices.
Next steps
Interested in building 7-star homes? Visit 7 Star Homes program to learn more about how SV can support you.
To learn more about the whole of home assessment, including how to use SV’s new tool, please express your interest in upcoming training opportunities.